It’s no wonder that the strategic use of LinkedIn is now a cornerstone of B2B marketing success. However, many professionals struggle when it comes to gauging the performance of their LinkedIn outreach campaigns.
Are your LinkedIn posts or articles reaching the right audience? Is your profile or company page attracting valuable leads or connections?
LinkedIn Analytics gives you access to a treasure trove of data about your LinkedIn performance.
But with so many numbers flying around, how to check LinkedIn Analytics? Where do you even begin? In this guide, we’ll discuss everything you want to know about LinkedIn Analytics, from the essential metrics to track to reporting and everything in between.
What Are LinkedIn Analytics?
LinkedIn Analytics Tool is your personal data dashboard on the platform. It allows you to track several crucial metrics, revealing how your LinkedIn profile and content are performing.
In other words, you can think of it as a behind-the-scenes peek into how your connections (and potential leads!) interact with you on the platform.
When you analyze these metrics, you get insights into:
- Visibility: How many people are seeing your profile? Are you reaching the right audience?
- Engagement: Are your posts sparking conversations and generating interest? What type of content resonates most with your audience?
- Click-Through Rates: Are people clicking on the links you share? Are your calls to action effective in driving traffic to your website or landing pages?
- Demographics: Who is your audience? Understanding the demographics of your profile visitors allows you to tailor your content and outreach strategies accordingly.
Where to Find LinkedIn Analytics?
The good news is that you can find LinkedIn Analytics in a few easy steps both for a company page and for your personal Post Analytics.
Here’s how to check LinkedIn Analytics:
For Company Page Analytics
- Log in to your LinkedIn account and ensure you’re switched to the administrator view of your company page.
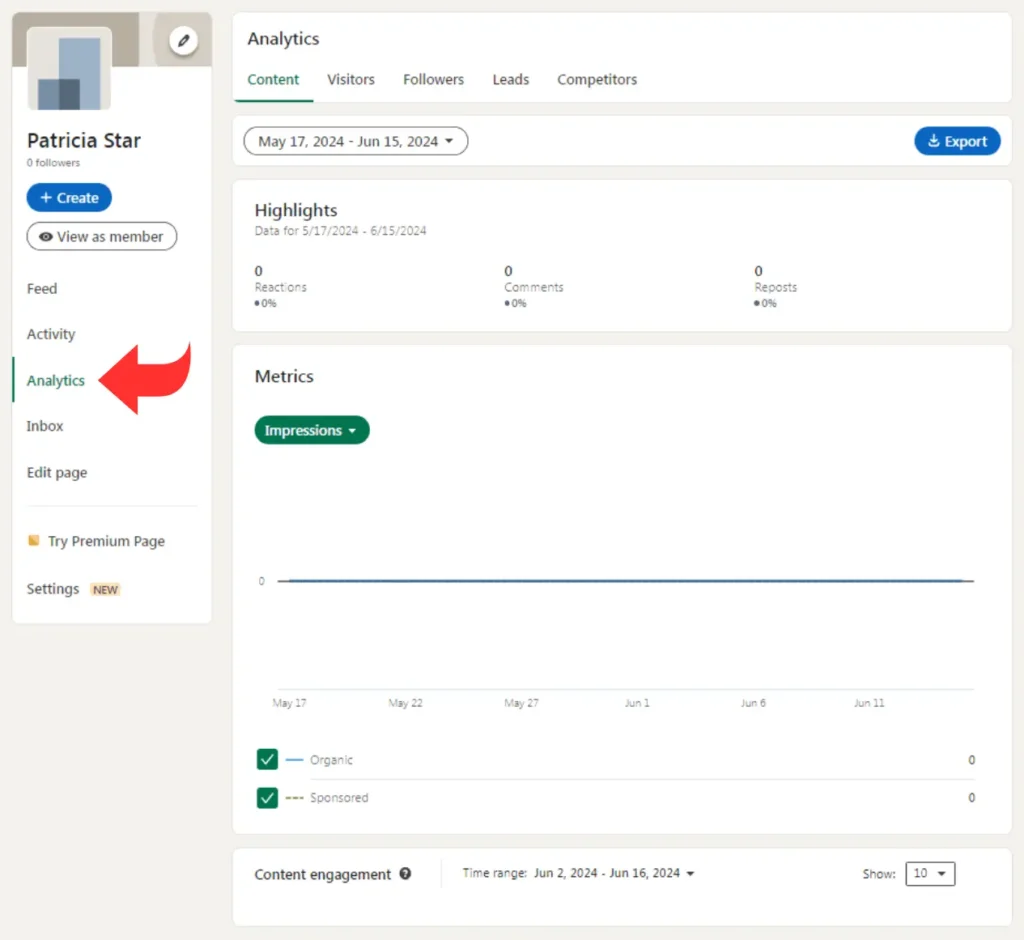
- On the left-hand side of your company page’s interface, locate the “Analytics” tab. Click on it, and prepare to be greeted by a wealth of valuable data.
- The Analytics dashboard presents a comprehensive overview of your company page’s performance, categorized into clear sections like Content, Visitors, Followers, Leads, and even Competitor and Employee Advocacy insights. Each section provides detailed metrics and trends, allowing you to analyze performance across various aspects of your LinkedIn strategy.
- For a quick snapshot of your company page’s performance over the past 30 days, look at the right-hand side of your main page feed. This readily available summary provides a handy overview of your page’s performance.
Important Note: To access company page analytics, you must be a page administrator or have “analyst” access within the page’s settings.
For Personal Profile Analytics
LinkedIn’s post analytics feature provides a window into the hearts and minds (well, at least the clickstreams) of your audience. The process for accessing your personal profile analytics is slightly different:
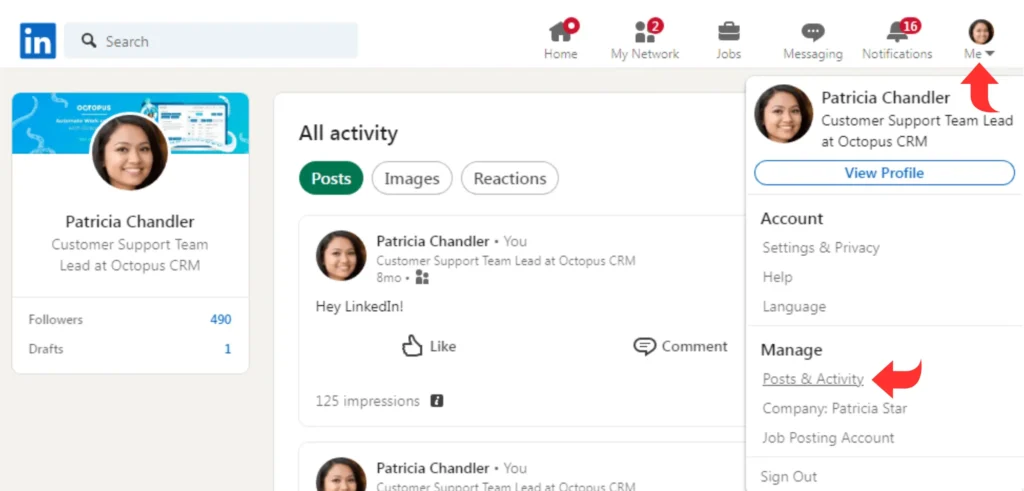
- Click the familiar “Me” icon at the top right corner of your LinkedIn homepage. Under the “Manage” section, find and click “Posts & Activity.”
- You’ll see a list of your posts on the screen. Choose between the “Articles” or “Posts” tab depending on the content you want to analyze.
- Click on the post you want to track and LinkedIn will present the number of impressions displayed as “[Number] impressions” or a dedicated “View Analytics” button in the lower right corner. Click on whichever option is available for your post.
- The “Post Analytics” page will show insights specific to the type of content you shared. For instance, you might see sections like “Discovery,” “Engagements,” and “Top demographics of unique viewers” for a standard post. Similarly, video and article posts will have tailored analytics sections showcasing performance metrics specific to those formats.
The “Engagements” section provides a detailed breakdown of how users interacted with your post. Click on the arrow next to “Reactions,” “Comments,” or “Reposts” to see a further breakdown of each category.
You can also sort the analytics by different metrics like “Reactions,” “Comments,” “Impressions,” or “Reposts” (if applicable) to identify which aspects of your post resonated most.
Furthermore, the LinkedIn Analytics tool allows you to filter your search results by audience demographics. Simply click on any of the tabs under “Reactions,” “Job title,” “Industry,” “Location,” “Seniority,” or “Company size” to see which specific audience segments interacted with your post the most.
How to Use LinkedIn Analytics
Remember, data is like a powerful language – it holds immense value, but only if you can understand it and know how to use it. The key here is to focus on the LinkedIn Analytics terms and metrics that directly align with your goals.
Here’s a breakdown of some key steps to use LinkedIn Analytics effectively:
1. Define Your Goals
Before jumping into the data, you should have clear goals for your LinkedIn presence. Are you looking to generate leads, build brand awareness, or connect with industry influencers?
2. Prioritize Relevant Metrics
LinkedIn Analytics presents a vast array of data points, which can be overwhelming. It is always good to focus on the metrics that directly impact your goals.
For instance, if you want to generate leads, metrics like profile views from decision-makers at your target companies can be helpful. But if brand awareness is your objective, you should monitor impressions and reach.
3. Analyze Trends Over Time
Don’t just take a snapshot. Instead, track your progress over time and monitor your chosen metrics regularly to identify trends. Are your impressions climbing? Is engagement increasing? Based on the results, you can tweak and improve your activities.
4. Benchmark Against Competitors
Use the LinkedIn Analytics tool to see how your performance stacks up against similar profiles or companies in your industry. This can be a valuable source of inspiration for new content strategies and identify areas for improvement.
5. Leverage Advanced Tools
The built-in LinkedIn Analytics dashboard offers a good starting point, but it might not provide the level of granularity you need.
It is a good idea to use the best LinkedIn Analytics Tools for your business. These tools offer advanced filtering and reporting functionalities, allowing you to gain even deeper insights and make more data-driven decisions.
Important LinkedIn Metrics to Track
Here are some key LinkedIn analytics metrics to keep an eye on:
Content Analytics
If your goal is to engage new audiences through your content, you should monitor the following content analytics:
Impressions
This metric shows the total number of times your post graced someone’s screen for at least 300 milliseconds, while also being at least 50% in view. Think of it as brand awareness on a basic level.
You might also want to track unique impressions, which show the number of individual members who saw your post (unlike impressions, this doesn’t count multiple views by the same user).
Reactions, Comments, and Shares
These metrics provide deeper insights than simple views. Reactions gauge emotional responses through emojis (likes, celebrates, supports, loves, etc.).
Comments reveal the depth of conversation sparked by your post, while Shares measure how effectively your content resonated and expanded its reach within the network.
Clicks
The Clicks metric measures the effectiveness of your call to action. Did users simply scroll past your post, or were they enticed to click on a link, your company name, or logo? Clicks signify genuine interest and engagement.
Engagement Rate
This metric provides a holistic view of content performance. LinkedIn calculates it by combining the number of interactions (reactions, comments, shares), clicks, and new followers acquired, all divided by the number of impressions your post received. A high LinkedIn engagement rate indicates content that truly resonates with your audience.
Follower and Visitor Analytics
Besides content performance, it is vital to know who’s interacting with your profile or company page. Here are some key metrics for followers and visitors:
Follower Analytics
- Follower Growth: Track the number of followers over time to see if your brand is attracting new connections.
- Total Followers: This metric simply shows your total followers to date.
- Follower Demographics: Use this metric to gain valuable insights into the demographics of your followers. This includes industry, seniority level, and location data. You can use the findings to tailor content to specific segments of your audience.
- All Followers List: This list lets you identify your most loyal followers. Consider reaching out with incentives to keep them engaged and foster stronger connections.
Visitor Analytics
- Page Views: The PageViews metric reveals the total number of times your company page was viewed.
- Unique Visitors: This metric counts how many people have visited your page, giving you a sense of overall audience interest.
- Visitor Demographics: Just like with follower demographics, understanding the job titles, company sizes, industries, locations, and seniority levels of your visitors helps you refine your content strategy and potentially unlock new target markets.
LinkedIn Profile Analytics
Even without a company page, you can leverage some valuable LinkedIn analytics metrics:
- Search Appearances: Track how often your profile pops up in search results during a given period.
- Post Views: See the total number of views for your posts, documents, or articles. You can also get more detailed metrics for individual posts like reactions, comments, and shares.
Premium Insights for Advanced Users
While these metrics provide a solid foundation, premium LinkedIn account holders get even more in-depth information. You can see details like the identities of users who viewed your profile, their job titles, and even the keywords they used to find you.
How to Create LinkedIn Analytics Reports in LinkedIn
The built-in LinkedIn Analytics dashboard is great, but sometimes you need more. As such, you might want to export LinkedIn Analytics reports (or take screenshots) for a closer look.
Key Reports to Export
- Campaign & Ad Performance: Analyze spending, impressions, clicks, and engagement to see what’s working.
- Audience Network Performance: See how campaigns perform beyond LinkedIn and compare stats.
- Demographics: Check details like company names and job titles of those interacting with your content.
- Conversion Performance: Understand the real impact of your campaigns by comparing conversion types.
- Leads: Identify interested prospects through Lead Gen Forms.
- Conversation Ad CTA Performance: Track clicks on call-to-action buttons within your conversation ads.
- Placement Performance: Discover where your campaigns perform best on LinkedIn and the Audience Network.
How to Create a LinkedIn Analytics Report in Octopus CRM
Choose Octopus CRM if you are looking for a more advanced reporting tool with more insightful information about your LinkedIn automation activities and campaigns.
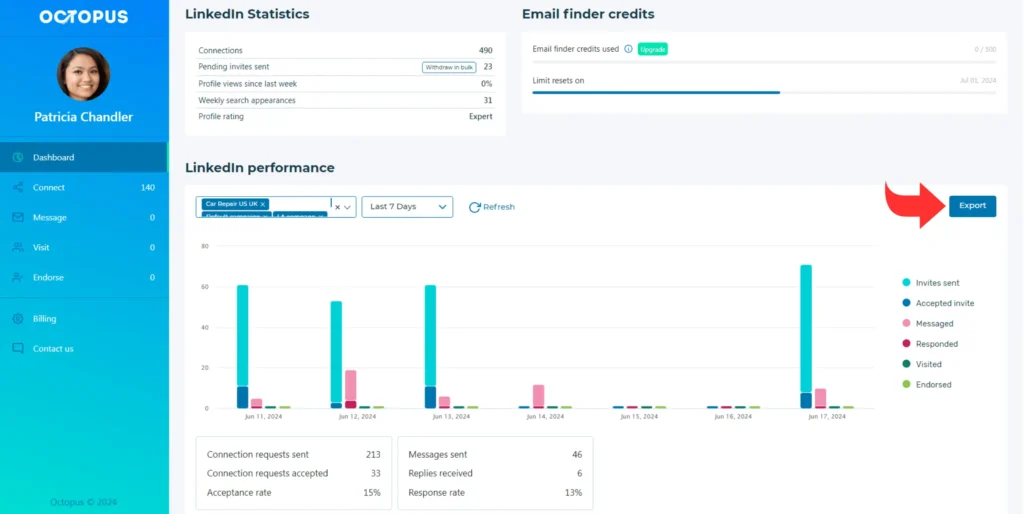
Octopus CRM goes beyond basic analytics, offering a comprehensive suite of reporting features. Octopus CRM LinkedIn Analytics Tool tracks key metrics, from connections to profile views, helping you optimize your outreach.
What’s more, you can launch your campaigns through Octopus CRM and revisit the analytics to see connection requests sent, skill endorsements generated, and even your acceptance and response rates.
Most importantly, Octopus CRM lets you export all this data into a handy CSV file. This means you’ll have your LinkedIn performance data at your fingertips so you can make data-driven decisions anytime.
LinkedIn Analytics Tips
- Know Your Audience: Monitor follower and visitor demographics (location, industry, seniority) to tailor content that resonates and converts.
- Decode Engagement: Analyze how your audience interacts with content (topics, formats). Use the findings to set goals, spark engagement, and schedule strategic posts.
- Content that Converts: Track post performance to identify winning formats (e.g., videos, polls). Experiment, analyze, and replicate successful strategies.
- Stay on Trend: Monitor trending topics and hashtags to see what interests your audience.
How to Grow Your Network on LinkedIn with Octopus CRM
Now that you know everything about LinkedIn Analytics, let’s talk about how you can grow your LinkedIn network with Octopus CRM.
Octopus CRM is a LinkedIn automation and LinkedIn lead-generation tool that helps you target the right audience at the right time.
Here’s how you can use it to grow your LinkedIn network:
- Automate personalized connection requests on LinkedIn, saving you valuable time and effort.
- Break free from weekly invite restrictions by sending connection requests directly through email using Octopus CRM.
- Connect with hundreds of 1st-level connections simultaneously with Octopus CRM’s bulk messaging feature.
- Automatically endorse up to 7 skills on your LinkedIn contacts’ profiles, fostering stronger connections.
- Octopus CRM automates profile visits, ensuring maximum reach and visibility within your network.
- Monitor your campaign success with detailed analytics and use those insights to refine your outreach strategy.
So, what are you waiting for? Start building meaningful relationships while Octopus CRM handles the heavy lifting. Get Octopus CRM free trial! It’s time to transform your LinkedIn experience from a chore to a strategic advantage.